Explore the market
Loading conversation.
Roblox Charts · Market sample: 254 distinct non-sponsored games across loaded charts.
Times show Romanum retrievals, not Roblox measurements. Title patterns are hypotheses; chart membership alone doesn't show growth. Sources and metric definitions
| Select games | Game | Genre | Created | |||||
|---|---|---|---|---|---|---|---|---|
 Steal An Eggand Collect Rare Pets | Simulation | 937.3K | 11.4B | 10M | 91.3% | 2.1B–4B | 2026-07-25 | |
 Throw Food For AnimalsGoofy Chupacabra | Simulation | 340.9K | 277.1M | 274.8K | 94.2% | 760.8M–1.5B | 2026-09-18 | |
 Break and Steal an EggILGames x Eggs | Simulation | 104.9K | 444.5M | 811.7K | 97.0% | 234.2M–453.3M | 2026-09-05 | |
 [🏝️UPD] Fish It! 🐟Fish Atelier | Simulation | 67.6K | 4.8B | 1.3M | 82.8% | 150.8M–291.9M | 2024-10-21 | |
 Fisch 🎩 [COMPANION HATS]Fisching | Simulation | 57.2K | 5.1B | 3.7M | 90.8% | 127.6M–247M | 2024-03-13 | |
 🍁 [TYCOON] Pet Simulator 99! 🍀BIG Games Pets | Simulation | 56.3K | 2.7B | 2.2M | 94.7% | 125.6M–243.1M | 2022-02-05 | |
 (TOWING x LIMITED UPDATE 🎃) Drag Drive SimulatorADV Gamers Team | Simulation | 50K | 697.6M | 3.4M | 95.6% | 111.7M–216.1M | 2025-01-15 | |
 [🏰] Tap Simulator REBORNCursor Makers | Simulation | 43K | 57.9M | 183.7K | 93.6% | 95.9M–185.7M | 2026-08-04 | |
 Sol's RNG [ Part 2 🎃 ]Sol's Studio | Simulation | 38.2K | 2.3B | 1M | 91.4% | 85.2M–164.8M | 2023-12-03 | |
 Fling Things and PeopleHoromori | Simulation | 36.8K | 3.7B | 2.7M | 80.5% | 82.1M–158.9M | 2021-06-16 | |
 Bee Swarm SimulatorOnett | Simulation | 35.9K | 4.7B | 6.6M | 95.6% | 80.1M–155.1M | 2018-03-21 | |
 Bloody Ragdoll Physics 🩸blablablablabla123123 | Simulation | 31K | 25.4M | 814.2K | 87.0% | 69.3M–134.1M | 2026-10-31 | |
 [🐟] Net a Fish!UpdatesDev | Simulation | 28.2K | 14.6M | 393.9K | 92.7% | 63M–122M | 2026-10-15 | |
 [💀] Steal a BrainrotBRAZILIAN SPYDER | Simulation | 27.6K | 74.5B | 29.8M | 85.1% | 61.6M–119.2M | 2025-05-16 | |
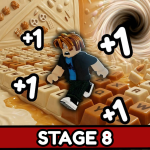 [S8] +1 Speed Keyboard Escape | Candy & ChocolateSecretVerse Studio | Simulation | 26.9K | 6.7B | 7.3M | 96.7% | 60.1M–116.3M | 2026-01-18 | |
 Sandworm PlaygroundKami Stuff. | Simulation | 26.9K | 8M | 23K | 88.1% | 60M–116.2M | 2026-11-02 | |
 Anime DiceMore & More Games | Simulation | 25.1K | 176.9M | 208.6K | 99.0% | 56.1M–108.6M | 2026-08-15 | |
 Driving Empire [✨LIMITED + DRIFT✨]Driving Empire by Voldex | Simulation | 25K | 3.4B | 31.8M | 93.0% | 55.7M–107.8M | 2019-06-23 | |
 صيد الضبّانLL's Studio | Simulation | 21.8K | 55.4M | 101.6K | 95.1% | 48.6M–94.1M | 2026-10-03 | |
 MAHANAKHON RACINGMAHANAKHON RACING | Simulation | 21K | 15.9M | 104.5K | 96.2% | 46.9M–90.7M | 2026-10-19 |